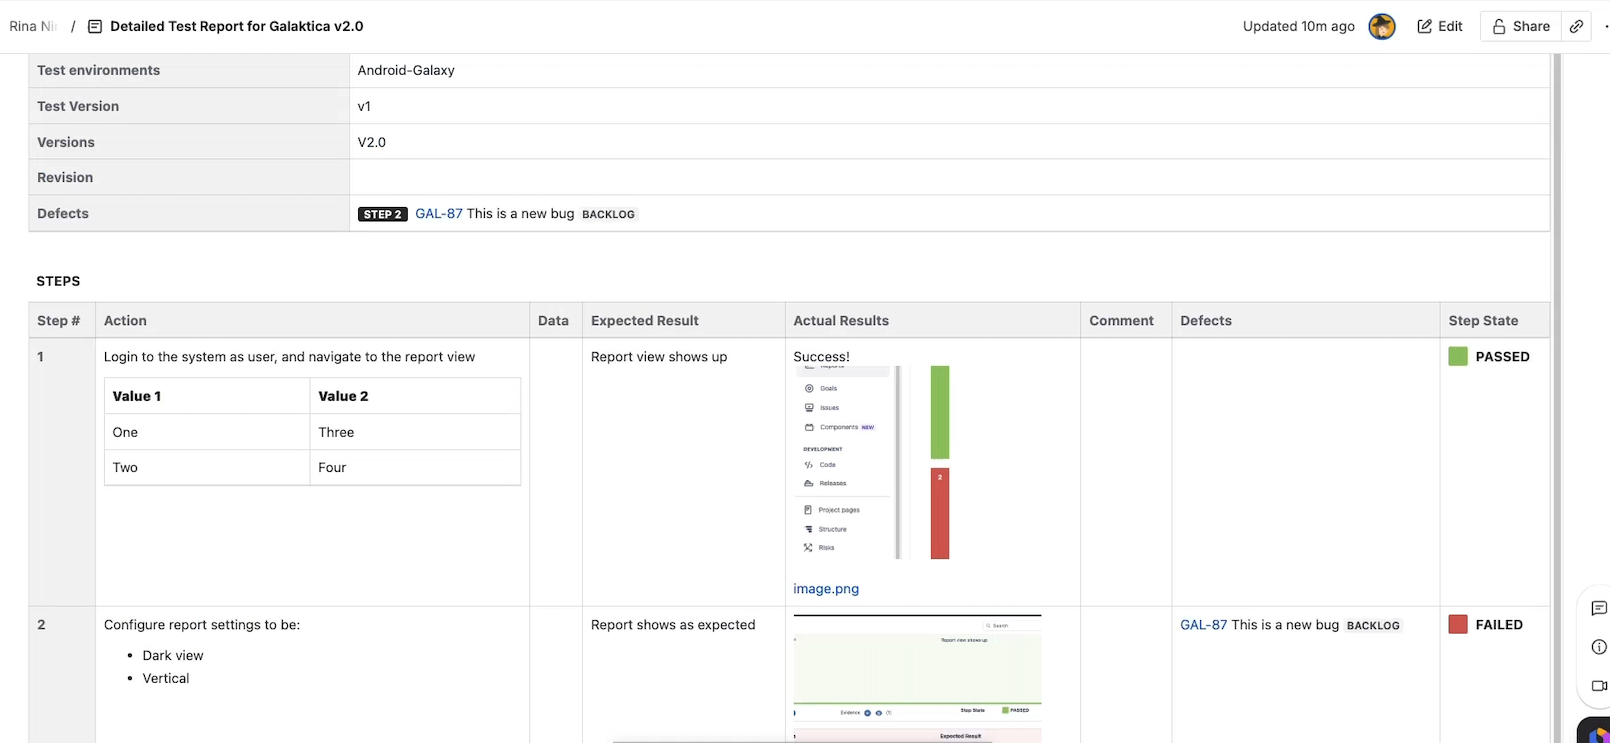
The Snapshots Test Report macro is a separate macro from the standard Snapshots macro. It's available only when the Traceability Extension is installed. Use it when you need a compliance-style, detailed test report — typically for audits, regulatory submissions, or formal sign-offs — where each test is presented with its full test run details, step results, defects, and evidence.
By the end of this page, you can build a detailed test report on a Confluence page and tune which tests, runs, and report sections appear.
When to use this macro vs. the regular Snapshots macro
|
Use case |
Macro |
|---|---|
|
A flat or hierarchical table of issues, possibly including some Xray fields |
Snapshots macro with Xray fields and test run levels |
|
A test report with full details about each test: one entry per test, with its latest run (based on criteria), full step details, defects, and evidence |
Snapshots Test Report macro |
|
A test plan (list of tests without runs) |
Snapshots Test Report macro with test runs disabled |
The Snapshots Test Report macro returns at most one test run per test (the latest matching the criteria), so it isn't suitable for showing run history. Use a test run level on the regular Snapshots macro for that — see Adding Xray data to snapshots.
Adding the macro to a page
-
Create or edit a Confluence page.
-
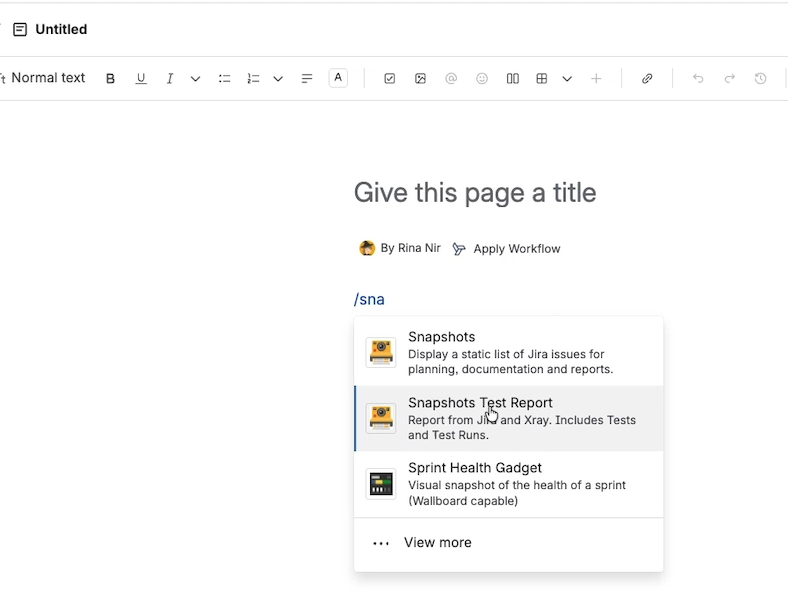
Where the report should appear, type
/and search forsnapshots. -
Two macros come up: Snapshots and Snapshots Test Report. Select Snapshots Test Report.
-
The macro configuration panel opens with three tabs: Configuration, Report Sections, and Layout.
-
Configure each tab (described below), insert the macro, publish the page, and click Take Test Snapshot in the prompt that appears.
The page now shows a header with the snapshot timestamp, sticker, compare control, and Take Test Snapshot button — similar to a regular snapshot, but tailored for the test report.
Configuration tab — selecting tests and runs
Selecting tests
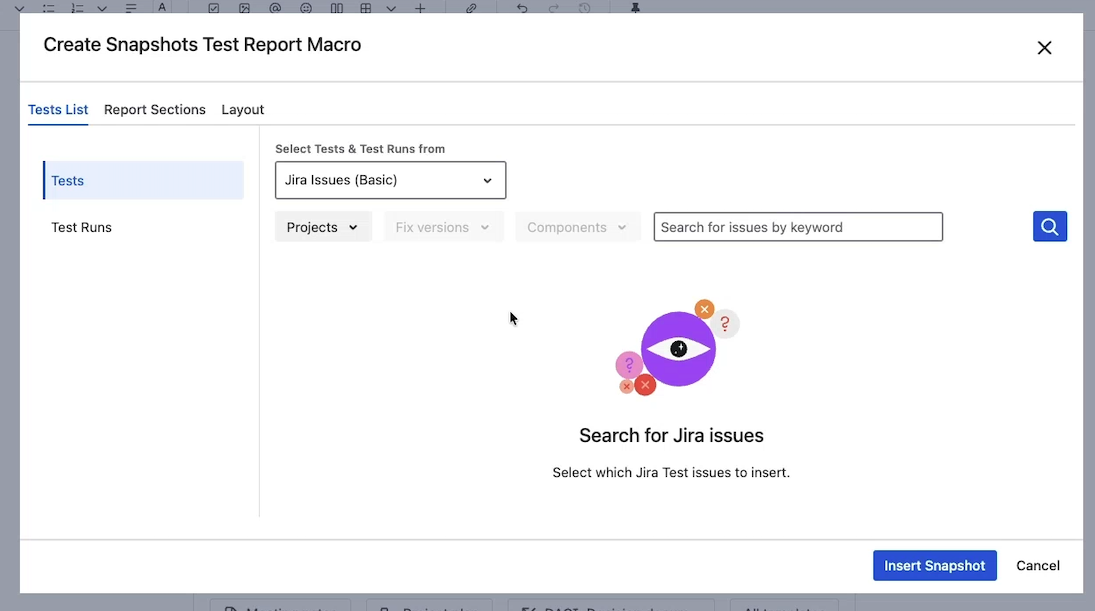
Three options for choosing which tests appear:
-
Simple criteria — pick a project, fixed version(s), component(s), and an optional keyword. Click Preview to verify the resulting test list.
-
JQL — enter a JQL string. Snapshots automatically filters the JQL to test issues, so you don't need to add
issuetype = Testyourself. -
Test plan — pick a Jira issue of type Test Plan; only tests linked to that plan are included.
Pick the one that fits the report's scope. JQL is the most flexible; test plan is best for reports tied to a specific approved test plan.
Including test runs
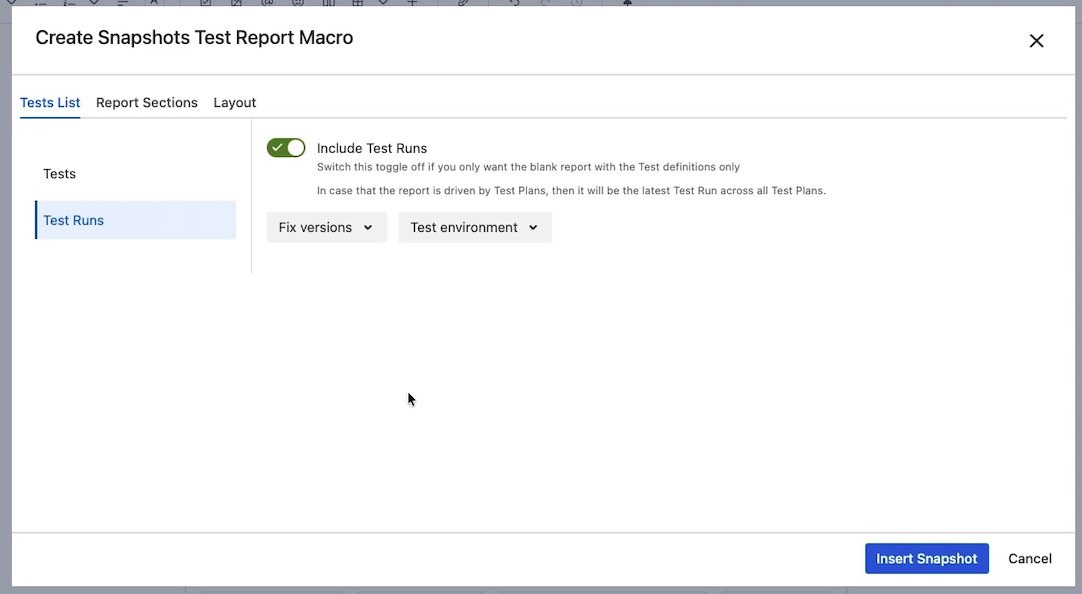
The Include test runs toggle is on by default. Turn it off to produce a test plan-style report — tests only, no run details.
When test runs are included, the macro retrieves at most one run per test. You can narrow which run is selected with two optional filters:
-
Fixed version — only consider runs associated with a specific Jira version. Useful for release-scoped reports.
-
Test environment — only consider runs from a specific Xray test environment, for example
productionordev.
If multiple runs match the filters, the macro picks the latest. If no runs match, the test appears with no run section.
Report Sections tab — what appears on the page
The report has four sections, each independently toggleable. Turn off the ones you don't need.
|
Section |
What it shows |
|---|---|
|
Test info |
Fields from the test issue itself: key, summary, type, fixed version, components, description, linked issues, preconditions. |
|
Test run info |
A link to the test run, plus run-level fields: status, execution time, executor, etc. Skipped if test runs are not included. |
|
Steps / Scenarios / Definitions |
Granular test execution data. Steps for manual tests. Scenario (Gherkin) for Cucumber tests. Definition for Generic tests. |
|
Evidence |
Screenshots and other attachments collected from each test run. By default, all evidence is collected at the end of the report so it can render at full page width — useful for auditors. Optionally place evidence after each test instead. |
For each section that's turned on, the Configure fields option lets you remove fields you don't need. Removing fields the report doesn't use shortens the document considerably — recommended, since detailed test reports tend to be long.
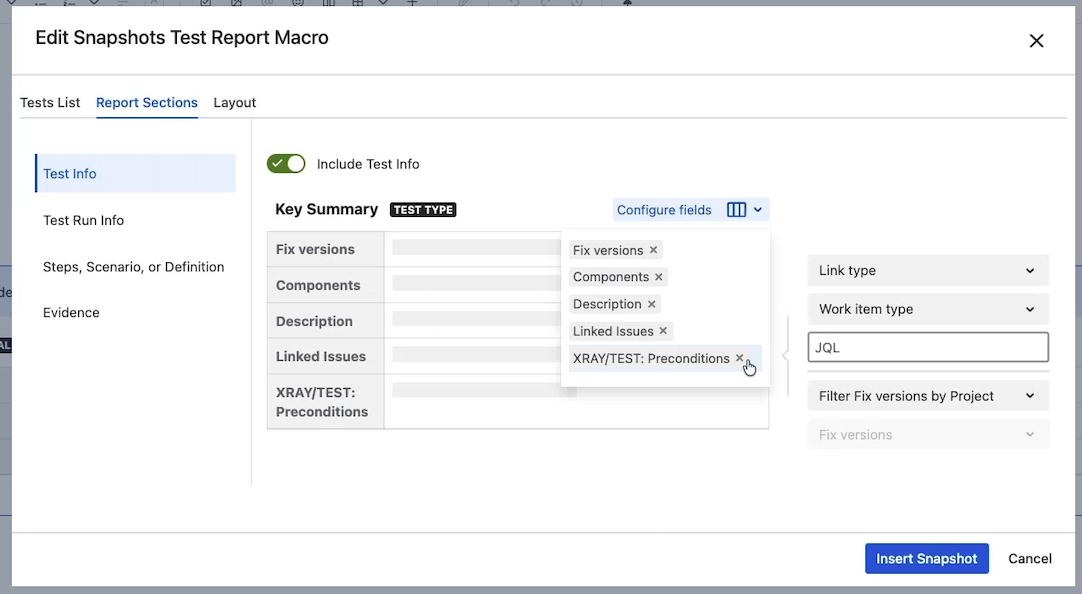
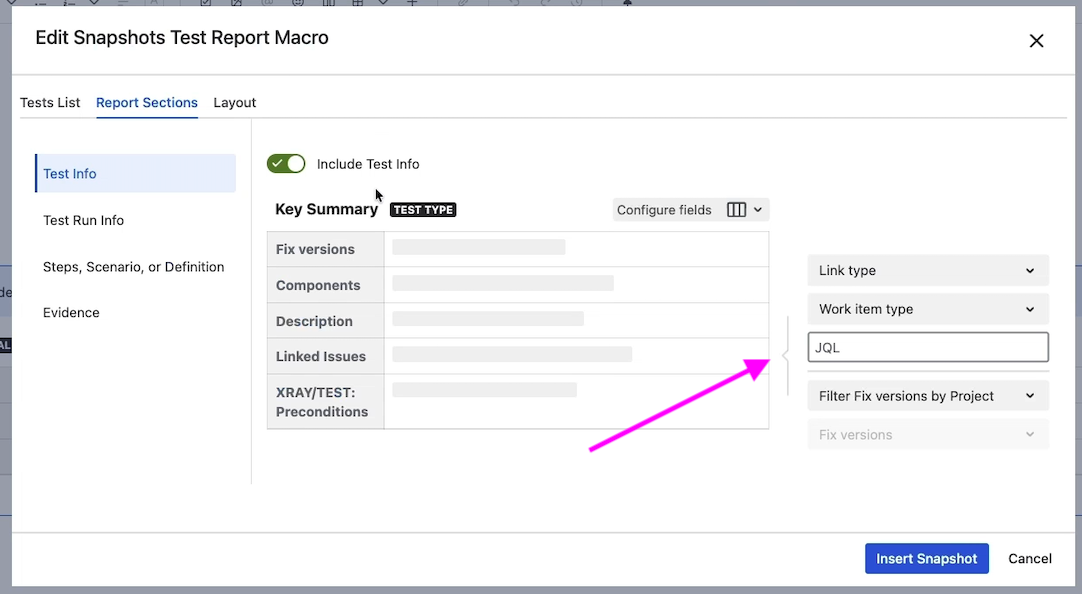
Linked issues filtering
Linked issues (in the Test info section) are particularly useful for showing coverage — for example, the user requirements a test covers. But not every link is meaningful for a report. The linked-issues panel lets you narrow which links appear:
-
By link type — for example, only "tests" or "covers."
-
By work item type — for example, only stories or epics, hiding implementation tasks.
-
By JQL — only links to issues matching a JQL.
-
By fixed version — only links to issues in a specific version, ideal for release-scoped reports.
Use these filters to keep the report focused on the links that matter for the audience.
Layout tab — display options
|
Option |
What it does |
|---|---|
|
Include defect status |
When ticked (default), each defect's Jira status appears alongside its key. Untick to show keys only. |
Refreshing the report
Like a regular snapshot, the Test Report macro captures data at the moment Take Test Snapshot is clicked. To refresh, click the same button on the page header.
The page-versioning model is the same as for regular snapshots: each new test snapshot adds a new page version, and you can compare versions through the Compare control. See How snapshots work for the underlying mechanics.
What's next
-
Configuring the Xray connection — required for this macro to work.
-
Adding Xray data to snapshots — using Xray fields and test run levels in the regular Snapshots macro.
-
Configuring multi-level snapshots — for hierarchical test/coverage reports built on the regular Snapshots macro.